Dining Out Spending Tracker: How Much Is Too Much to Spend Eating Out?
Find out if your dining-out spending is above or below the national average for your income. Set a weekly dining cap and get a spending alert before you overshoot.
Yulia Lit
Consumer Psychology & Behavioral Economics Researcher
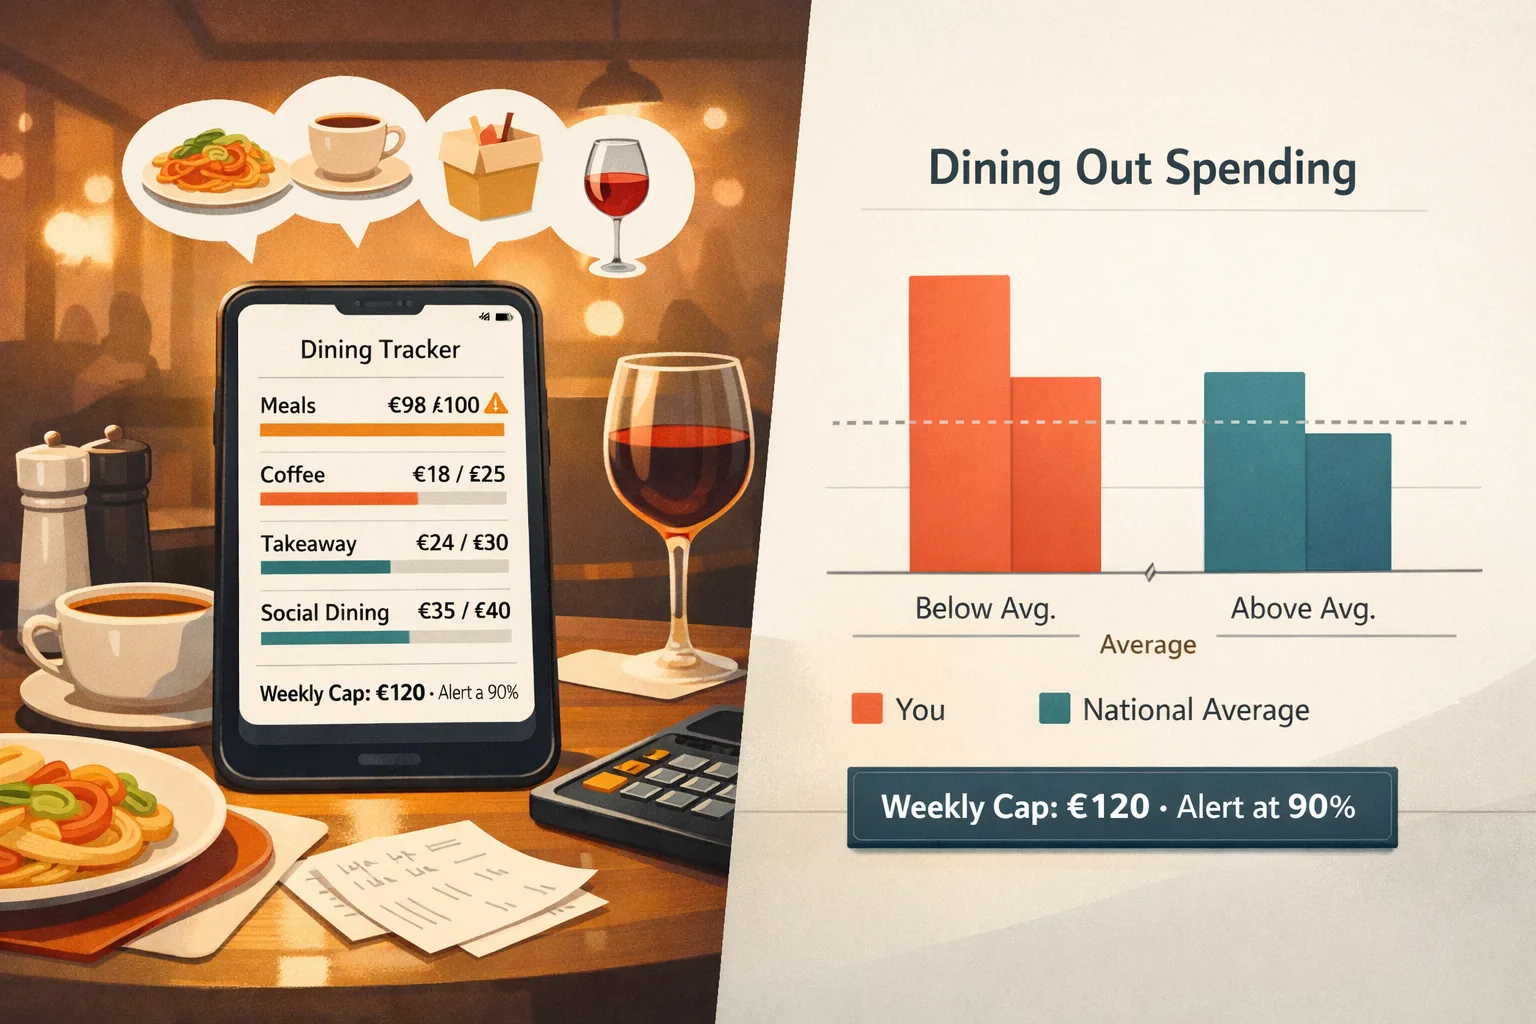
Dining Out Spending Tracker: How Much Is Too Much to Spend Eating Out?
The average American household spent $3,639 on food away from home in 2024 — $303 per month, according to the Bureau of Labor Statistics Consumer Expenditure Survey. For households earning $40,000–$75,000 per year, this represents approximately 7% of take-home income directed exclusively to restaurants and takeout. For households earning under $40,000, the same category absorbs 10–12% — the highest share of any income bracket by percentage.
These numbers would be less alarming if dining out were treated as a deliberate, planned category. The research problem is that it usually is not. A 2025 LendingClub study found that 71% of Americans who identified "eating out" as a category they overspend on could not name their actual monthly dining-out total within 30% accuracy. They knew they were overspending — they did not know by how much.
Tracking dining-out spending is one of the highest-ROI financial habits available, because the category is simultaneously large, discretionary, and consistently underestimated.
Key Takeaways
- Restaurant and takeout spending is the #1 category Americans report overspending on, per NerdWallet's 2025 spending habits survey
- Most households underestimate their dining-out spend by 25–40% — the gap between what people think they spend and what bank statements show
- The BLS national average for dining out varies significantly by income bracket — comparison to your income-adjusted benchmark is more useful than a generic "budget under $X" rule
- Each additional $100/month spent dining out above benchmark costs the household approximately $1,200/year — and $9,600 over 8 years if that money had been invested at 7% return
- Setting a weekly dining cap (rather than monthly) creates more behavioral friction at the point of spending — the feedback loop is tighter
- Spending alerts triggered at 80% of your monthly dining budget are more effective than alerts at 100% — they leave room to adjust behavior before the cap is breached
Why Dining Out Is the Hardest Category to Control
Three structural features of restaurant spending make it resistant to budgeting:
1. Fractional decision-making. Dining out decisions are made one meal at a time, each appearing affordable in isolation. The $15 lunch, the $28 dinner, the $12 delivered breakfast — none of these trigger a budget check because individually they feel small. The category only becomes visible in aggregate, which is too late.
2. Social and emotional context. More dining out happens in contexts where declining to spend feels socially costly — colleague lunches, date nights, family gatherings, celebrations. This makes category-level cuts feel like social restrictions rather than financial decisions, which is why people avoid confronting the number.
3. No physical inventory signal. Grocery overspending is bounded by storage — you cannot buy 400 items if your refrigerator holds 100. Restaurant spending has no equivalent physical constraint. The only limit is time and money, and only one of those gets tracked.
Information
In-app food delivery (DoorDash, Uber Eats, Grubhub) adds 30–50% to effective food cost through service fees, delivery fees, inflated menu prices, and tips. A $25 restaurant meal ordered through delivery costs $37–$45 all-in. If you track "dining out" as a category, delivery orders should be included — but separately labeled so you can see the markup you are paying for convenience.
How Your Dining Spend Compares to National Averages
Use the benchmark tool to compare your monthly dining-out spend against BLS national averages for your income bracket:
Dining Spend Benchmark
How Does Your Dining Spend Compare?
Enter your monthly restaurant and takeout spend plus your income range — we'll compare you to BLS national averages and give you a personalized target.
e.g. 400
Understanding Your Benchmark
The BLS Consumer Expenditure Survey measures actual spending, not recommended spending. The national average is descriptive — it tells you what households in your income bracket are actually spending, not what they should be spending.
What the benchmark tells you:
- If you are above the national average for your income bracket, you are spending more than most comparable households on dining out — which may or may not be the right choice depending on your other financial priorities
- If you are on target, you are spending an amount typical for your income level — but typical does not mean optimal for your financial goals
- If you are below the national average, you are either consciously prioritizing other spending or genuinely spending less than comparable households
What the benchmark does not tell you:
- Whether your dining spend aligns with your budget and financial goals
- Whether you are getting value for what you spend
- How much of your dining spend is discretionary vs. work-related or socially obligated
The benchmark is a calibration tool, not a verdict. If your dining spend is 40% above the national average and you are meeting all your other financial goals, the question is whether you are consciously choosing that trade-off. If you are not meeting your goals and dining is 40% above average, the answer is clearer.
How to Set a Realistic Dining Budget That Sticks
The 5-step process:
Step 1: Identify last month's actual dining spend
Pull your bank or credit card statement. Sum every restaurant charge, delivery order, coffee shop visit, and work lunch. Include the tip. Include the delivery fees. This number will likely be 25–40% higher than your intuitive estimate.
Step 2: Compare to your income-adjusted benchmark
Use the tool above. If you are more than 20% above the benchmark for your income bracket, that is the signal.
Step 3: Set a monthly target, not a daily budget
Daily dining budgets fail because spending is lumpy — $0 on Monday, $0 on Tuesday, $80 on Wednesday's work lunch and dinner out. A monthly cap creates the right time horizon. Set a specific dollar amount: "My dining budget for May is $250."
Step 4: Convert the monthly cap to a weekly check-in
Divide your monthly cap by 4.33 (average weeks per month). If your cap is $250, your weekly check-in target is $57.74 — call it $60. At the end of each week, check actual spend against $60. This weekly feedback loop catches overspending before it compounds to a monthly problem.
Step 5: Set a spending alert at 80% of your monthly cap
The most effective alert threshold is 80%, not 100%. An alert at 100% means you have already breached the budget with no room to adjust. An alert at 80% leaves two weeks and 20% of budget for conscious decisions about remaining spend.
In Yomio, set a category alert for "Dining Out" at 80% of your monthly budget. You receive a notification in real time — not at the end of the month when the damage is done.
Warning
Many people justify high dining-out spend by noting that they eat at healthy restaurants rather than fast food. Nutritional quality and cost are independent variables. A premium fast-casual meal costs $18–$25. A home-cooked equivalent costs $4–$7. The health framing does not change the financial outcome.
Specific Tactics to Reduce Dining Spend Without Eliminating It
Cutting dining out to zero is not a viable strategy for most people. Social life, work obligations, and convenience needs make some level of eating out appropriate for almost every household. The goal is intentional dining, not dietary deprivation.
The highest-leverage reductions:
Replace delivery with pickup (saves 25–35%). Delivery fees plus tip adds $12–$20 to most orders. Picking up the same order eliminates that cost entirely. If you order delivery twice per week and switch to pickup, you save $1,200–$2,000 per year with zero change to the food you eat.
Designate work lunches as a specific sub-budget. Work lunches are often the most invisible part of dining spend because they feel mandatory and occur daily in small increments. A $12 lunch every workday is $250/month in an invisible subcategory. Meal prepping 3 days per week and buying 2 reduces this to $100/month without eliminating the social function of the occasional bought lunch.
Use the one-sit-down-restaurant rule. Limit full sit-down restaurant meals to one per week per person. All other dining out is delivery, takeout, or fast-casual. This retains the experience of restaurant dining while substantially reducing the frequency of the highest-cost format.
Front-load social meals on the calendar. Unplanned dining out is more expensive than planned dining out. When you know you have a dinner out on Saturday, you are less likely to add unplanned dining on Thursday and Friday. Putting dining commitments on the calendar creates a natural frequency cap.
The Impulse Ordering Problem
The research on digital food ordering is stark: a 2023 Deloitte study on digital dining behavior found that app-based food ordering generates 30% more impulse orders than in-person or phone orders — driven by visual menus, personalized recommendations, and the elimination of social friction from in-store ordering.
The implication: if delivery apps are on your home screen, dining spend will be higher than you intend it to be. The behavioral economics literature calls this "friction reduction increasing consumption." Moving delivery apps off your home screen, requiring a deliberate retrieval step before ordering, reduces impulsive delivery frequency by 15–25% in controlled trials.
For a broader look at how digital dark patterns increase spending, see impulse spending and system design.
More from Yomio
- How to stop overspending using alerts — set automated spending alerts for dining and every other category
- Impulse spending and system design — why apps are designed to increase your food spending and how to resist
- Spending limits by category — compare all your categories to BLS benchmarks, not just dining
- Monthly spending review — how to catch category drift before it compounds