How to Track Grocery Spending (and Actually Cut It) in 2026
Track grocery costs from your own receipts, separate food from other purchases, and use actual spending to set a realistic plan.

Yulia Lit
Consumer Psychology & Behavioral Economics Researcher
How to Track Grocery Spending (and Actually Cut It) in 2026
To track grocery spending, save each receipt, record the total and date, and separate grocery items from non-food purchases when the receipt includes both. Compare your actual weekly or monthly totals with the amount available in your budget, then make one change that fits your household. National averages cannot tell you what your groceries should cost.
Receipt scans can make purchase records easier to review, but item extraction may be incomplete or wrong. Check the items and amounts before using the scan to make a decision.
Information
The U.S. Bureau of Labor Statistics reported that food-at-home prices were 2.2% higher in August 2026 than in August 2025. This national average does not describe every product or household, so use your own receipts to see how your basket changes. See the BLS CPI table for August 2026 for the category data.
Tip
Small top-up trips can disappear inside a monthly total. If you want to see whether they affect your spending, label them consistently and compare their totals with planned shops using your own receipts. The result will depend on your stores, products, and household needs.
Key takeaways
- Use your own receipts and spending records as the baseline.
- Decide what belongs in your grocery total, especially for mixed store trips, delivery, and household supplies.
- Review categories that matter to you, such as produce, meat, snacks, or household items.
- Compare prices and package sizes for products you already buy; do not assume a swap will work for every household.
- Receipt scanning can organize details, but review extracted item names, prices, and categories.
Decide what counts as grocery spending
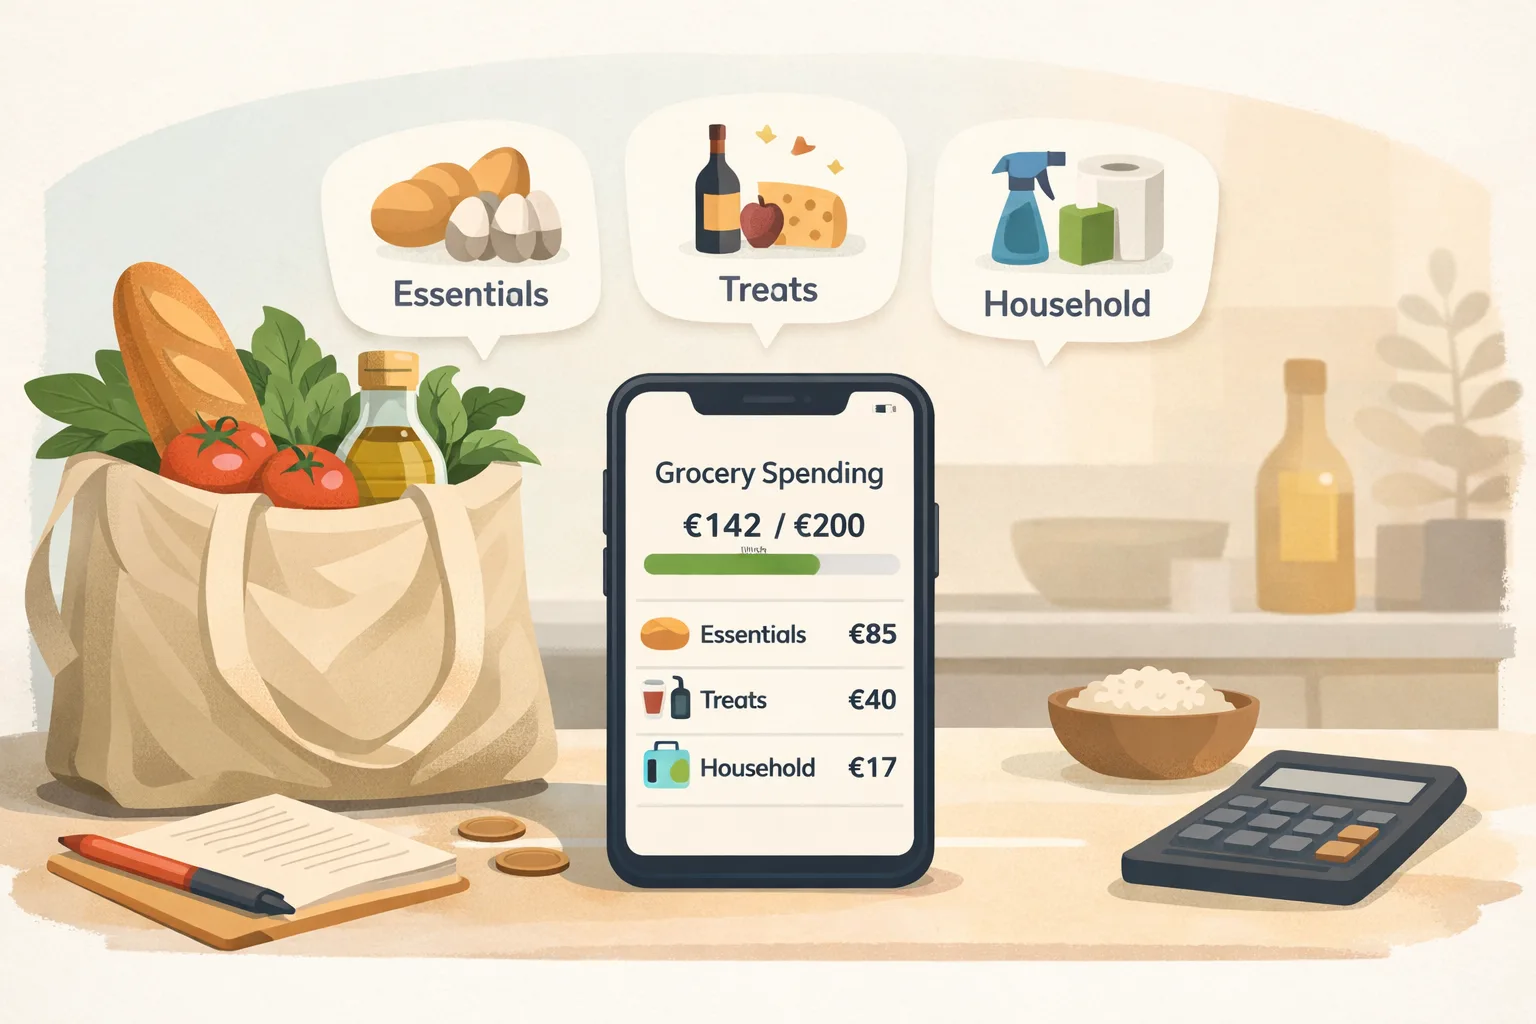
Choose a consistent definition before comparing weeks. Some shoppers include food and household basics in one total; others track cleaning supplies, pet food, alcohol, or personal care separately. Either approach can work if you use it consistently.
Keep delivery charges, tips, and service fees separate when you want to understand the cost of convenience. If a store receipt mixes groceries and non-food items, identify those items before comparing food totals.
Build a useful record from each shop
For each purchase, keep:
- The date and store.
- The total paid and the receipt image or digital receipt.
- A note or category for non-food items or fees if you separate them.
- Item details when available and useful for your review.
Review receipt scans for missing or misread line items. Correcting the record before you compare totals helps prevent mistakes from looking like spending changes.
Record grocery spending by category
Choose categories and enter your own weekly amounts. The tool adds only the values you enter.
Use the same currency for every amount. This tool does not convert currencies.
Choose at least one category.
Review spending and choose one adjustment
At the end of a week or month, compare your grocery records with the amount you planned to spend. Look for a specific pattern you can act on: food that often goes unused, a product with a lower-cost substitute you would actually use, or an unplanned extra trip that could be combined with another errand.
Compare unit prices when package sizes differ. Read labels and check that the product is suitable for your household before choosing a store brand, bulk size, or alternative ingredient. A lower shelf price may not mean a lower cost per usable amount.
Plan meals around food you already have, then write a list for the items you need. A list is a planning aid, not a guarantee of lower spending; prices, availability, household needs, and food preferences vary.
Keep the plan flexible
Grocery costs change with household size, location, dietary needs, prices, and schedules. If your planned amount does not fit current needs, update the budget rather than treating a missed target as a personal failure. If money for food is not enough to cover basic needs, check local assistance and food programs.
Tip
Compare your own recent grocery records using the same definition of grocery spending. Change one category or shopping habit at a time so you can see whether it helps.
Common tracking mistakes
Comparing totals that include different items. A store trip can include food, household supplies, and other goods. Separate those costs or keep them in one combined category every time.
Treating an OCR scan as verified data. Check names, quantities, and prices before relying on extracted line items.
Setting a target from someone else's budget. Household needs and local prices differ. Start with your recent records and choose a goal that fits your income and essential costs.
Changing too many habits at once. Try one practical adjustment, then check your next receipts to see whether it suits your household.
Keep grocery purchase details easy to review
Capture receipt details or enter grocery expenses manually, then review your own spending records over time.
Explore Yomio