What a Receipt Total Hides: A Six-Month Data Study
We studied 15,179 Yomio expense records to see what sits behind a receipt total. Explore category overlap, item counts, interactive charts, and open aggregate data.
Yomio Team
Analysis of Yomio app records
A payment total tells you what a purchase cost. A receipt can help explain what sits inside it. Imagine buying bread, detergent, and shampoo in one visit: one payment covers food and household goods. We asked how often saved line items span several categories, and how much detail sits behind one total.
We examined 15,179 receipt-linked expense records from 1,514 Yomio users, dated April 10 through October 9, 2026. This is a study of records saved in our app, with categories that have not been checked against receipt images. It shows where item detail can help explain a total, and where the data needs care.
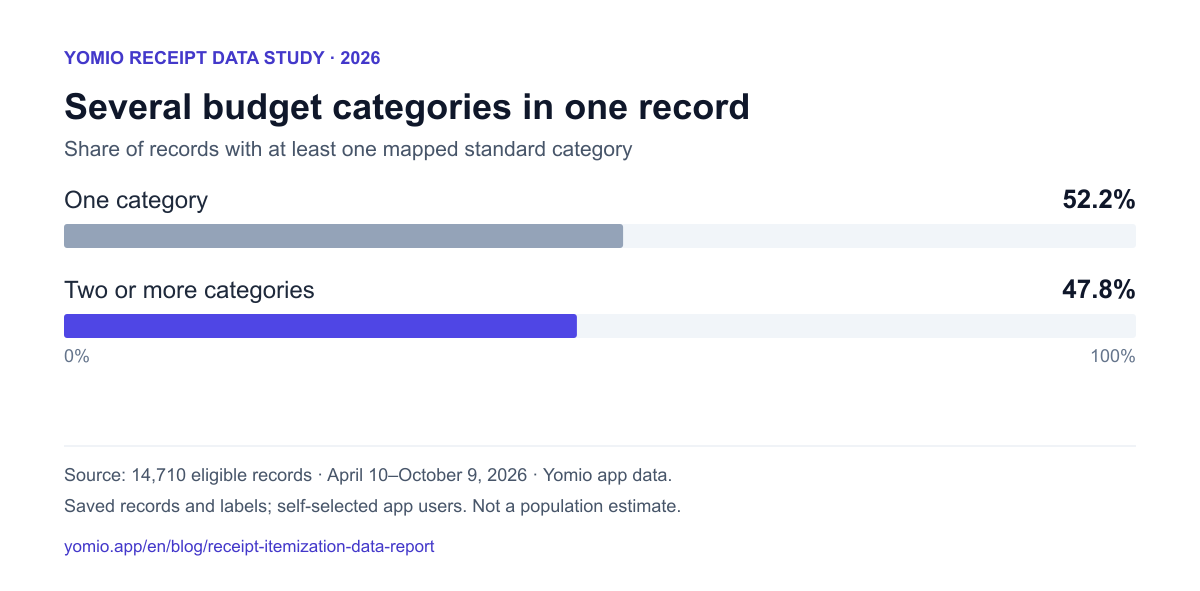
Nearly half the classified records span several categories
For each record, we mapped its saved product categories to broad groups such as groceries, transport, and household care. We counted distinct groups, so several grocery subcategories still counted as one grocery category.
How many budget categories sit inside one record?
14,710 records with at least one mapped standard category, grouped by the number of broad categories on their product rows.
- One category52.2%
- Two or more categories47.8%
See the counts and sample details
| Group | Records | Share of records | Distinct users |
|---|---|---|---|
| One category | 7,672 | 52.2% | 1,075 |
| Two or more categories | 7,038 | 47.8% | 1,172 |
This gives a practical reason to split a receipt when you review a budget. A single label for the whole purchase can hide costs that belong in different categories. The chart measures category presence; it does not measure how the money was split.
Grocery and household categories often overlap
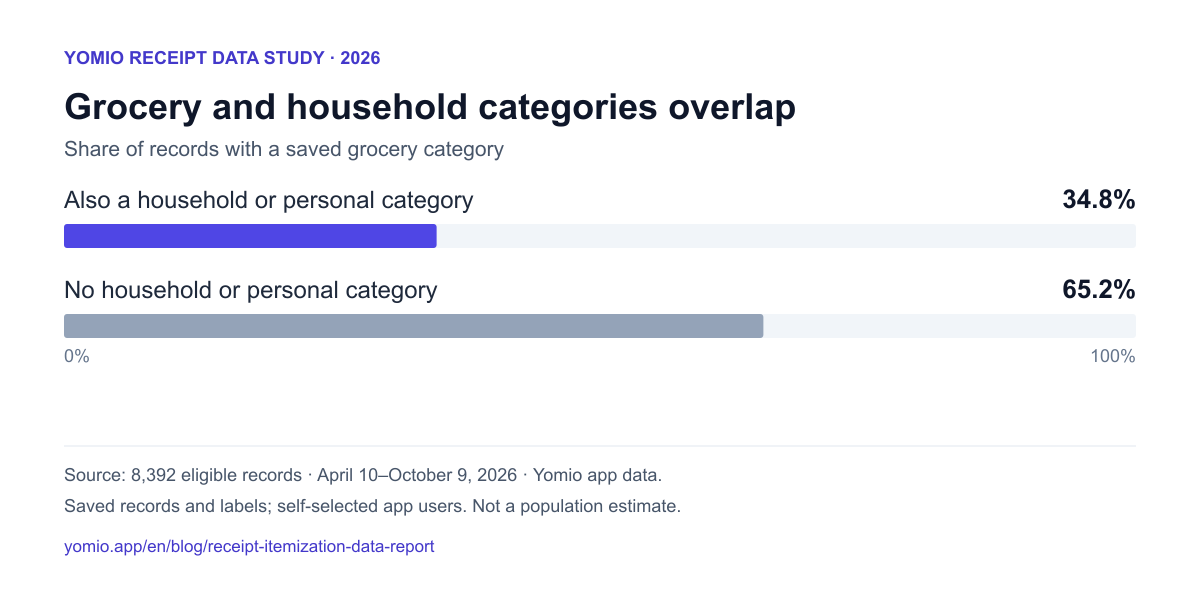
The grocery records offer a familiar example of that overlap. About one in three carried both a saved grocery category and a household or personal category.
When grocery and household categories share a record
8,392 records with a grocery category, split by whether a household or personal category also appears.
- Also a household or personal category34.8%
- No household or personal category65.2%
See the counts and sample details
| Group | Records | Share of records | Distinct users |
|---|---|---|---|
| Also a household or personal category | 2,917 | 34.8% | 766 |
| No household or personal category | 5,475 | 65.2% | 948 |
If your grocery budget looks higher than expected, check what else shares those receipts before you decide that food costs caused the increase. Cleaning supplies or personal care items may belong in another part of your budget. This result counts saved labels, so it cannot tell us which specific products were present or how much they cost.
One total can contain a lot of detail
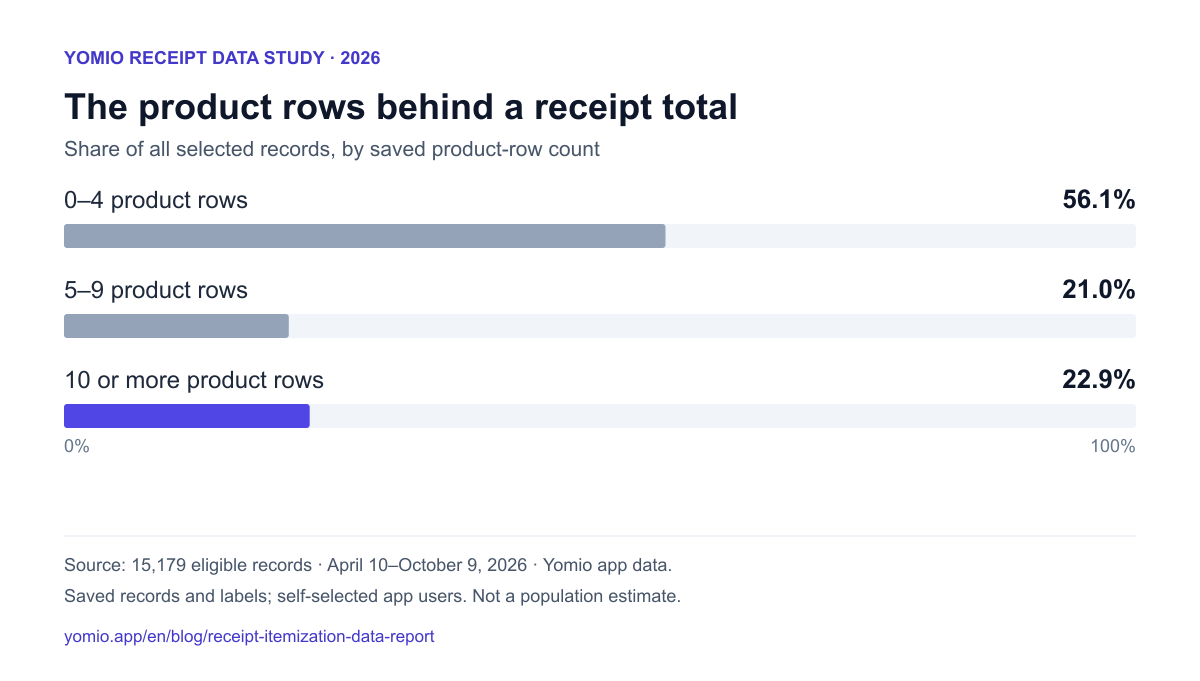
The median record contained four product rows. The distribution also has a long tail: some totals sit above many more rows that a transaction history would not show.
The detail behind a receipt total
All 15,179 records, grouped by saved product rows. A row is not a unit or a verified distinct product.
- 0–4 product rows56.1%
- 5–9 product rows21.0%
- 10 or more product rows22.9%
See the counts and sample details
| Group | Records | Share of records | Distinct users |
|---|---|---|---|
| 0–4 product rows | 8,517 | 56.1% | 1,073 |
| 5–9 product rows | 3,183 | 21.0% | 777 |
| 10 or more product rows | 3,479 | 22.9% | 861 |
A product row is one saved line, and its quantity can cover several units. The count excludes separate discount rows. This is a measure of the detail stored in a record, rather than a count of goods bought or a measure of extraction accuracy.
How to read the findings
We selected expense records with a saved approval status and a receipt link, using the purchase date for the six-month window. All links matched separate receipt objects owned by the same user. The approval status is an app field; it does not establish a manual quality check.
We used Yomio's standard category hierarchy as it stood at extraction on October 11, 2026. Custom categories were excluded from the category mapping. At least one standard category mapped on 96.9% of records; the first chart uses that classified subset. Each published chart group includes at least 100 distinct users.
The users chose which records to save. The most active tenth contributed 65.3% of the records, so the findings reflect frequent contributors more strongly. They do not estimate the habits or spending of all households.
A receipt history can also miss expenses with no saved receipt. In a 2025 household-panel study by Wenz and colleagues, adding direct entries to scanned receipts brought reported spending closer to the UK national survey benchmark. That is a reason to include other payments when you build a personal budget.
These results do not estimate inflation. As the US Bureau of Labor Statistics explains, changes in average prices can reflect changing products and sample composition; the CPI follows the same or comparable items in the same outlet. For a personal comparison, see our guide to tracking household price changes with receipts.
Use the data or cite a chart
The release contains aggregate counts, definitions, and sample limits. It contains no user IDs, receipt images, merchant names, or exact item names.
- Download the aggregate CSV, JSON data, or methods and citation.
- Download a chart: category overlap, grocery and household mix, or product rows per record.
Suggested citation: Yomio Team (2026), What a Receipt Total Hides: A Six-Month Data Study. Link to this report and keep the app-sample context with any figure you use.
See which costs share your receipts
Use Yomio to save receipt line items, review their categories, and look beyond the purchase total.
Explore item-level trackingWhat to take into your next budget review
When a category looks unusually high, look inside the receipts assigned to it. Separating the items can help you see whether the change comes from food, household goods, or another cost that shares the same payment.