Yomio'nun AI Yardımcısı Harcamalarınızı Nasıl Analiz Eder: Cevaplayabileceği 5 Soru
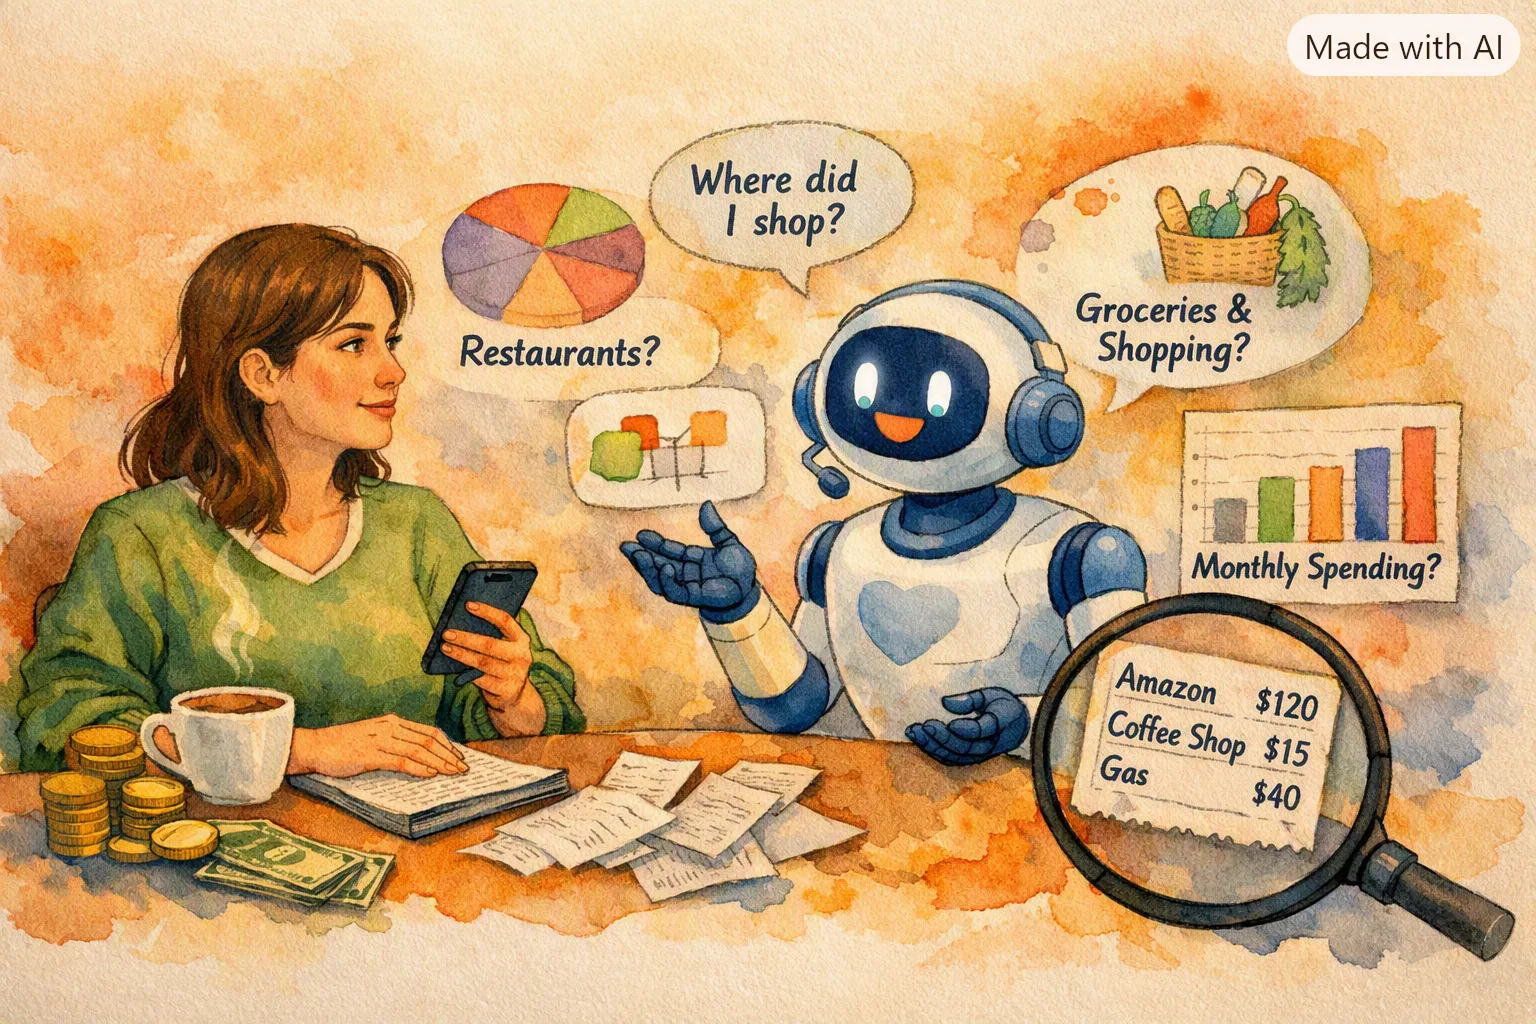
Paranızın nereye gittiğini tahmin etmeyi bırakın. Yomio'nun AI yardımcısı Yopilot, harcamalarınız hakkında gerçek soruları — satıcı dökümlerinden kategori trendlerine kadar — doğal dilde yanıtlar.

Alex Chen
Product Manager & Personal Finance Advocate
Yomio'nun AI Yardımcısı Harcamalarınızı Nasıl Analiz Eder: Cevaplayabileceği 5 Soru
Yomio'da aylarca birikmiş harcama veriniz var. Bunun değerli olduğunu biliyorsunuz. Ancak grafikler arasında gezinmek ve içgörüler elde etmek için manuel olarak filtrelemek sıkıcıdır — bu yüzden çoğu insan bunu yapmaz.
Ya sadece sorabilseydiniz?
Yopilot'un yaptığı tam olarak budur. Harcama verilerinizi anlayan ve bunlarla ilgili doğal dil sorularını yanıtlayan bir AI konuşma asistanıdır. Bu makale, Yopilot'un cevaplayabileceği beş gerçek soruyu, cevapların neyi ortaya çıkardığını ve daha iyi finansal kararlar almak için bunları nasıl kullanacağınızı açıklamaktadır.
Önemli Çıkarımlar
- Yopilot, gerçek harcama verilerinizi analiz eder — genel tavsiyeler değil — doğal dilde
- Soru 1 — "Nerede fazla harcıyorum?" toplamlarda göremediğiniz kategori düzeyindeki sızıntıları ortaya çıkarır
- Soru 2 — "Geçen ay bakkaliyeye ne kadar harcadım?" size trendlerle birlikte anlık kategori toplamları verir
- Soru 3 — "Bu ayı geçen ayla karşılaştır" aylık değişiklikleri bir bakışta gösterir
- Soru 4 — "En çok hangi satıcıda harcıyorum?" harcamalarınızı yönlendiren belirli mağazaları belirler
- Soru 5 — "Bana hafta sonu ve hafta içi harcamalarımı göster" varlığından haberdar olmadığınız davranış kalıplarını ortaya çıkarır
- Öğe düzeyindeki veriler tüm bunları mümkün kılar — Yomio ile fiş tarama her bir satır öğesini yakalar
Sorun: Veriniz Var Ama İçgörünüz Yok
İçgörü
Düzenli olarak fiş tarayan ortalama bir Yomio kullanıcısı, ayda 200'den fazla veri noktası biriktirir — satıcılar, kategoriler, satır öğeleri, fiyatlar, miktarlar. Bir AI katmanı olmadan, 200 veri noktasından eyleme dönüştürülebilir içgörüler çıkarmak, çoğu insanın zamanı olmayan manuel çaba gerektirir. Yopilot, bu boşluğu soru başına yaklaşık 3 saniyede kapatır.
Çoğu gider takip uygulaması size toplamlarınızı gösterir. Size grafikler gösterir. Harcamalarınızı otomatik olarak kategorize bile edebilirler.
Ancak belirli sorularınızı yanıtlamazlar.
Bir kontrol paneline bakmanız, kategoriye göre filtrelemeniz, sayıları incelemeniz, geçen ayla manuel olarak karşılaştırmanız ve kendi sonuçlarınızı çıkarmanız gerekir. Bu 15-30 dakika sürer ve çoğu insan pes etmeden önce bunu bir kez (yaparlarsa) yapar.
Soru 1: "Nerede fazla harcıyorum?"
İpucu
Bütçe aşımlarının %80'i, kategorilerin %20'sinden gelir. Yopilot, hangi %20 olduğunu saniyeler içinde belirler — bir düzine grafik arasında gezinmek zorunda kalmadan.
Bu, insanların Yopilot'a sorduğu en yaygın sorudur — ve en açıklayıcı olanıdır.
Yopilot'un yaptığı
Yopilot, seçtiğiniz zaman dilimini analiz eder, harcamalarınızın tipik kalıpları aştığı kategorileri belirler ve bunları varyansa göre sıralar. Size sadece bir sayı söylemez — temel çizginizden en çok sapan kategorileri vurgular.
Ne öğrenirsiniz
Çoğu kullanıcı, aşırı harcamanın eşit şekilde dağılmadığını keşfeder. 1-3 kategoride yoğunlaşmıştır. Yaygın bulgular:
- Dışarıda yemek, zihinsel tahmininizden %40 daha yüksektir
- İçecekler (kahve dükkanları, şişe içecekler, smoothie barları) ayda $120-$180 arası bir kategoridir ve bunu hiç ayrı olarak takip etmediniz
- Kolaylık alışverişleri (hazır yemekler, teslimat ek ücretleri, ekspres kasa ürünleri) bakkal faturanıza %15-25 ekler
Bunun üzerine nasıl harekete geçilir
Hangi 1-3 kategorinin aşırı harcamaya neden olduğunu bildiğinizde, odaklanmış bir hedefiniz var demektir. Bu kategorilerde %20'lik bir azalma — başka hiçbir şeyi değiştirmeden — genellikle gerçek harcama ile bütçe arasındaki boşluğu kapatır.
Soru 2: "Geçen ay bakkaliyeye ne kadar harcadım?"
Basit soru. Öğe düzeyinde takip olmadan doğru yanıtlaması şaşırtıcı derecede zor.
Bunun neden zor olduğu
Banka hesap özetiniz "Kroger $187.43" ve "Whole Foods $94.20" gösterir — ancak bu toplamlar, yiyecekleri ev malzemeleri, kişisel bakım ve bazen evcil hayvan malzemeleriyle karıştırır. Çoğu uygulamada "bakkaliye" kategorisi, satıcının bakkal olarak sınıflandırdığı şeydir. Bu sizin gerçek yiyecek harcamanız değildir.
Yopilot'un yaptığı
Yomio, öğe düzeyinde takip ettiği için (fiş tarama sayesinde), Yopilot aynı mağazadan satın alınan gerçek yiyecek alımları ile gıda dışı ürünler arasında ayrım yapabilir. Bakkal harcamanızı şu şekilde böler:
- Taze ürünler — meyve ve sebzeler
- Proteinler — et, balık, yumurta, tofu
- Süt ürünleri ve alternatifleri
- İçecekler
- Atıştırmalıklar ve paketli gıdalar
- Gıda dışı ürünler (temizlik, kişisel bakım, ev) — yiyecek harcamasından ayrılmıştır
Ne öğrenirsiniz
Tipik kullanıcı, gerçek yiyecek harcamasının "bakkal" toplamından %25-35 daha düşük olduğunu — ancak içecek ve atıştırmalık harcamalarının tahmin ettiğinden %40-60 daha yüksek olduğunu keşfeder. Zihinsel model ile gerçek veriler arasındaki uyumsuzluk neredeyse her zaman önemlidir.
Soru 3: "Bu ayı geçen ayla karşılaştır"
Bilgi
Değişen kategorilerle sabit bir toplam bir kırmızı bayraktır — farkında olmadan bir harcamayı bir başkasıyla değiştiriyorsunuzdur. Yopilot'un karşılaştırma modu, bu değişimleri otomatik olarak yüzeye çıkarır.
Aylık karşılaştırma, finansal farkındalığın temelidir. Ancak çoğu insan sadece toplamları karşılaştırır ve bu da önemli değişiklikleri kaçırmalarına neden olur.
Yopilot'un yaptığı
Yopilot, iki dönemi birden çok boyutta karşılaştırır:
- Kategori düzeyindeki değişiklikler — dışarıda yemek %12 arttı, bakkaliye %8 düştü, ulaşım sabit
- Toplam harcama farkı — yüzde ile toplu değişim
- Satıcı değişimleri — yeni mağazalar görünür, eskileri kaybolur
- Dikkat çeken anormallikler — aydan aya %20'den fazla hareket eden kategoriler
Ne öğrenirsiniz
Kategori düzeyinde aydan aya karşılaştırma, toplamların gizlediği trendleri ortaya çıkarır. Örneğin:
- Toplam harcamanız aydan aya sabitti (iyi görünüyor)
- Ancak bakkaliye $80 düşerken dışarıda yemek $95 arttı (toplamlara bakarak kaçıracağınız bir davranış değişikliği)
- Veya mevsimsel klima kullanımı nedeniyle faturalarınız $40 arttı (beklenen, ancak teyit etmek iyi)
Bunun üzerine nasıl harekete geçilir
Her ay tutarlı bir şekilde hareket eden kategorileri takip edin. Yüksek varyansa sahip kategoriler (eğlence, dışarıda yemek, alışveriş), küçük davranış değişikliklerinin en büyük bütçe etkisini yarattığı kategorilerdir.
Soru 4: "En çok hangi satıcıda harcıyorum?"
Bu soru, harcama yoğunlaşmasını ortaya çıkarır — dolarlarınızın ne kadarının tek bir mağazaya veya hizmete gittiğini gösterir.
Yopilot'un yaptığı
Yopilot, seçilen dönem için satıcılarınızı toplam harcamaya göre sıralar ve şunları gösterir:
- Toplam harcamaya göre ilk 5 satıcı
- Ziyaret sıklığı — orada ne sıklıkta alışveriş yaptığınız
- Ortalama işlem büyüklüğü
- Satıcı başına kategori dökümü — her yerde ne satın aldığınız
Ne öğrenirsiniz
Tipik kullanıcı, 3-5 satıcının takip edilen toplam harcamalarının %60-70'ini oluşturduğunu keşfeder. Yaygın ilk sıradaki satıcılar şunları içerir:
- Birincil bakkal — genellikle #1, sık sık toplam harcamanın %20-30'u
- Amazon veya eşdeğeri — tipik olarak #2, şaşırtıcı derecede geniş bir kategori dağılımı ile
- Benzin istasyonu — tutarlı haftalık işlem, ziyaret başına daha küçük ancak yüksek sıklık
- Bir restoran veya yemek dağıtım servisi — genellikle #4 veya #5, ziyaret başına beklenenden daha yüksek
Bunun üzerine nasıl harekete geçilir
En iyi satıcınız genellikle optimizasyon için en yüksek ROI'li yerdir. Birincil bakkalınız toplam harcamanın %25'ini oluşturuyorsa, orada %10'luk bir azalma (bakkal tasarrufu kılavuzumuzda ele alınan taktikler aracılığıyla) herhangi bir beş küçük kategoriyi bir arada optimize etmekten daha fazla genel bütçenizi etkiler.
Soru 5: "Bana hafta sonu ve hafta içi harcamalarımı göster"
Bu, çoğu kullanıcının sormayı düşünmediği sorudur — ve en şaşırtıcı cevapları üreten sorudur.
Yopilot'un yaptığı
Yopilot, işlemlerinizi hafta içi (Pazartesi–Perşembe) ve hafta sonu (Cuma–Pazar) olarak ayırır, ardından karşılaştırır:
- Toplam hafta sonu ve hafta içi harcaması
- Her grup için günlük ortalamalar
- Gün türüne göre kategori dökümü — hafta sonlarında ne değişir
- Görsel karşılaştırma — boşluğu net bir şekilde görün
Ne öğrenirsiniz
Veriler, çoğu insan için hafta sonu harcamalarının günlük olarak hafta içi harcamalarından %35-55 daha yüksek olduğunu tutarlı bir şekilde gösterir. Değişim şunlar tarafından yönlendirilir:
- Restoranlar ve dışarıda yemek — hafta sonları 2-3 kat daha yüksek
- Eğlence — konserler, filmler, iş günlerinde olmayan etkinlikler
- Perakende alışveriş — satın almaya dönüşen boş zaman gezintileri
- Sosyal etkinlikler — grup yemekleri, bar hesapları, paylaşılan deneyimler
Hafta sonu priminin kendisi kötü değildir — hafta sonları hayatın yaşandığı zamandır. Ancak boşluğun büyüklüğünü bilmek, paranın nereye gittiğini merak etmek yerine hafta sonu harcamaları hakkında bilinçli kararlar almanıza yardımcı olur.
Hepsini Bir Araya Getirmek: Yopilot Haftalık Kontrol
En etkili Yopilot kullanıcıları haftalık bir kontrol yapar: 2-3 soru sorar, cevapları not eder ve küçük bir ayarlama yapar. Bir çeyrekte, bu küçük ayarlamalar harcama modellerinde önemli değişikliklere dönüşür.
Örnek haftalık kontrol (5 dakika):
- "Bu haftayı geçen haftayla karşılaştır" — 30 saniye
- "Bu ay nerede fazla harcıyorum?" — 30 saniye
- "Verilerimde anormallik var mı?" — 30 saniye
- Gözden geçir ve bir eylem not et — 3 dakika
Try Asking Yopilot
Tap a question to see what Yopilot would answer based on your data.
Veri Temeli: Fiş Tarama AI'yı Neden Çalıştırır
Yopilot'un cevapları, dayandıkları veriler kadar iyidir. Manuel gider girişi seyrek ve tutarsızdır — insanlar işlemleri unutur, sayıları yuvarlar veya hatırlamak istemedikleri öğeleri atlarlar.
Yomio ile fiş tarama, Yopilot'un cevaplarını doğru yapan öğe düzeyinde veriler sağlar. Her tarama şunları yakalar:
- Satıcı adı — normalleştirilmiş ve yinelenenlerden arındırılmış
- Tarih ve saat — tam işlem zaman damgası
- Satır öğesi dökümü — fiyat ve miktar ile birlikte satın alınan her öğe
- Kategori ataması — otomatik olarak kategorize edilmiş, manuel olarak incelenebilir
- Ödeme yöntemi — nakit, kart veya hesap
Sonuç: Yopilot'a bir soru sorduğunuzda, harcadığınızı hatırladığınız şeyden değil, tam, yapılandırılmış verilerden yanıt verir.
Yopilot'u Ücretsiz Deneyin
Premium'a yükseltin ve Yopilot'a ilk sorunuzu 30 saniyeden kısa sürede sorun. 14 günlük ücretsiz deneme, taahhüt yok.
Ücretsiz Denemenize BaşlayınSıkça Sorulan Sorular
Daha Fazla Okuma

Seriler Neden İşe Yarar: Bütçelemeyi Eğlenceli Hale Getiren Oyunlaştırma Sistemi
Başarılar ve seriler, gider takibini gerçekten sürdürmek isteyeceğiniz bir alışkanlığa nasıl dönüştürür.
Fiş tarama mı manuel giriş mi?
Tarama sonuçlarını nasıl kontrol edip düzelteceğinizi öğrenin.

Sizi Güç Kullanıcısı Yapan 10 Gizli Yomio Özelliği
Yomio'nun sahip olduğunu bilmediğiniz özellikler — envanter, alışveriş listeleri, barkod tarama ve daha fazlası.